Currency Correlation Chart Explained
October 16, 2025•1 min read
Currency Strength Meter Team
Forex Analyst & Writer
#forex#correlation#pair analysis#risk management
Introduction
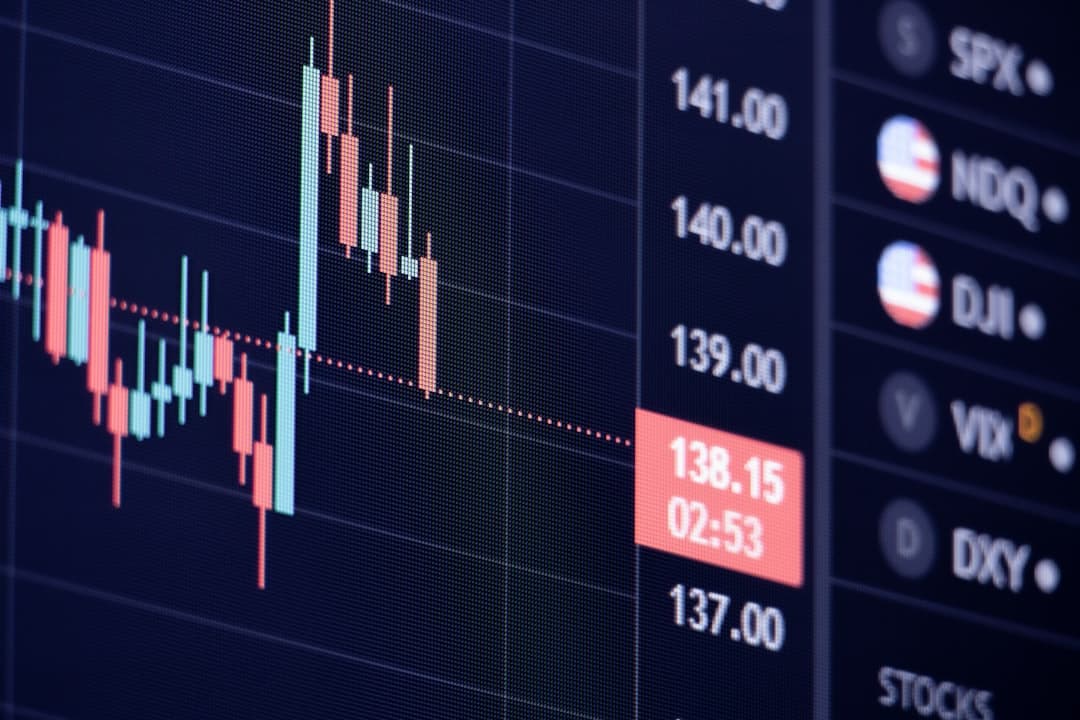
A currency correlation chart shows how different forex pairs move in relation to each other — a vital tool for controlling exposure and improving portfolio balance.
Understanding Correlation
- Positive Correlation: Pairs move in the same direction (EUR/USD & GBP/USD).
- Negative Correlation: Pairs move oppositely (USD/JPY & EUR/USD).
- Zero Correlation: No consistent relationship.
How to Use It
- Avoid trading multiple pairs with high positive correlation.
- Hedge risk by pairing positively and negatively correlated positions.
- Combine correlation data with strength meters for clearer direction.
Conclusion
Correlation charts prevent overexposure and duplication of risk — essential for professional money management in forex.
🔹 Key Takeaways
- Use strength meters to spot strong/weak pairs quickly.
- Combine with price action for accurate entries.
- Stay aware of major economic events.
💬 Comments
Comments feature coming soon! Traders will be able to share insights and questions here.